
EIGHT GRADE > 8.F.2 > TEACHER GUIDE
TEACHER GUIDE TO CLARIFICATION

8.F.2
Define, evaluate, and compare functions.
8.F.2 Compare properties of two functions each represented in a different way (algebraically, graphically, numerically in tables, or by verbal descriptions). For example, given a linear function represented by a table of values and a linear function represented by an algebraic expression, determine which function has the greater rate of change.
Compare Two Functions from Different Representations
This standard has students comparing two functions from different representations. The representations can be, but are not limited to, an algebraic equation, a graph, a table of values or a verbal description.
Example 1:
Compare the two linear functions listed below and determine which equation represents a greater rate of change.
Comparing:
Graphs
Tables
Equations

Different representations could be an equation, table, graph or verbal description
Function 1:
Function 2:
The functions whose input, x and output, y are related by
y = 3x + 7
Solution: Since Function 1 has a slope of 2 and Function 2 has a slope of 3, the equation in Function 2 has a greater rate of change.
Example 2:
Compare the two linear functions listed below and determine which has a negative slope.
Function 1: Gift Card
Samantha starts with $20 on a gift card for the bookstore. She spends $3.50 per week to buy a magazine. Let y be the amount remaining as a function of the number of weeks, x.
Function 2:
The school bookstore rents graphing calculators for $5 per month. It also collects a non-refundable fee of $10.00 for the school year. Write the rule for the total cost (c) of renting a calculator as a function of the number of months (m).
Solution:
Function 1 is an example of a function whose graph has negative slope. Samantha starts with $20 and spends money each week. The amount of money left on the gift card decreases each week. The graph has a negative slope of -3.5, which is the amount the gift card balance decreases with Samantha‘s weekly magazine purchase. Function 2 is an example of a function whose graph has positive slope. Students pay a yearly nonrefundable fee for renting the calculator and pay $5 for each month they rent the calculator. This function has a positive slope of 5 which is the amount of the monthly rental fee. An equation for function 2 could be c = 5m + 10.
Kansas Association of Teachers of Mathematics (KATM) Flipbooks. Questions or to send feedback: melisa@ksu.edu.
Retrieved from Math Flipbooks.
Example 3:
From the PARCC sample test items
http://parcc.pearson.com/practice-tests/math/
Students will see questions like:
Function A and function B are linear functions. Function A is represented by the table of values. Function B is represented by the equation.
Function A
x
y
1
2
3
10
14
4
7
26
Function B
y = 3x + 4
Which statements about the properties of Function A and Function B are true?
Select each correct statement.
A. The y-intercept of Function A is equal to the y-intercept of Function B.
B. The y-intercept of Function A is less than y-intercept of Function B.
C. The y-intercept of Function A is greater than y-intercept of Function B.
D. The rate of change of Function A is equal to the rate of change of Function B.
E. The rate of change of Function A is less than the rate of change of Function B.
F. The rate of change of Function A is greater than the rate of change of Function B.
In this problem, students must choose all statements that are true. Both B and F are correct answers in the problem above.

Math practice 1 – Multiple representations of functions helps to move students from concrete to abstract thinking.
Math practice 8 – Use repeated reasoning to determine equations for functional relationships.
Coherence and Connections: Need to Know
Grade Below
Grade Level
Grade Above
7.RP.2
8.EE.5
8.EE.6
8.F.1
8.F.2
8.F.3
8.F.5
F.IF.1
Before students learn the term “function,” students begin to gain experience with functions in elementary school. In Kindergarten, they use patterns. In Grades 4 and 5, students prepare for functions using standards 4.OA.5 and 5.OA.3. In these standards, students generate patterns that follow a given rule. In Grades 6, students work with equivalent ratios and gain experience with tables and graphs and the correspondences between them. In Grade 7, students recognize and represent an important type of regularity in the numerical tables – the multiplicative relationship between each pair of values – by equations of the form y = cx identifying c as the constant of proportionality in equations and other representations.
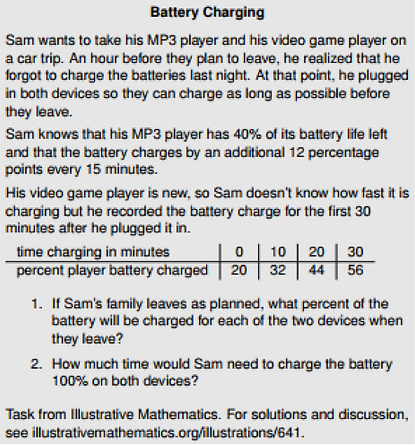
Building on their earlier experiences with graphs and tables in Grades 6 and 7, students establish a routine of exploring functional relationships algebraically, graphically, numerically in tables, and through verbal descriptions.(8.F.2) They explain correspondences between equations, verbal descriptions, tables, and graphs (MP.1). Repeated reasoning about entries in tables or points on graphs results in equations for functional relationships (MP.8). To develop flexibility in interpreting and translating among these various representations, students compare two functions represented in different ways, as illustrated by “Battery Charging”.
Common Core Standards Writing Team. (2013, March 1).
Progressions for the Common Core State Standards in Mathematics (draft). Grade 8, High School, Functions.
Tucson, AZ: Institute for Mathematics and Education, University of Arizona
8.F.2 offers an opportunity for in-depth focus: “work toward meeting this standard repositions previous work with tables and graphs in the new context of input/output rules.”
PARCC Model Content Frameworks: Mathematics Grades 3-11 (version 5). (2017, November).
Retrieved from https://files.eric.ed.gov/fulltext/ED582070.pdf

Now using input/output rules

Illinois Assessment of Readiness Mathematics Evidence Tables https://www.isbe.net/Documents/IAR-Grade-8-Math-Evidence-State.pdf
Evidence
Statement Key
Evidence Statement Text
Clarifications
MP
8.F.2
Compare properties of two functions each represented in a different way (algebraically, graphically, numerically in tables, or by verbal descriptions). For example, given a linear function represented by a table of values and a linear function represented by an algebraic expression, determine which function has the greatest rate of change.
i) Tasks have “thin context” or no context.
ii) Equations can be presented in forms other than y = mx +b, for example, 2x + 2y =7.
2,5
Calculator
Yes
Also check out Student Achievement Partners Coherence Map.
Classroom Resources
Teacher Tube lesson on 8.F.2 This video is helpful for teachers who have never taught functions or need a refresher course on comparing slopes and intercepts of functions. This video is not meant to be shown to students. Teachers should be moving away from direct instruction. Students learn best when they are doing the work in the class. Give them plenty of problems and allow them to put information into tables, equations and graphs. Allow students to compare the slopes and y-intercepts.
http://www.teachertube.com/video/8f2-compare-slopes-and-intercepts-of-functions-288400
National Library of Virtual Manipulatives – Function Machine This is an interactive manipulative that allows students to determine outputs when given inputs.
http://nlvm.usu.edu/en/nav/frames_asid_191_g_3_t_2.html?from=category_g_3_t_2.html
HOT Questions
x
y
1
3
5
7
7
17
27
37
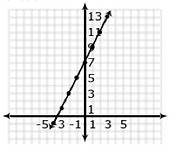
Function A and B are linear functions. Function A can be represented by the table below.
Function B can be represented by the equation y = 3x - 1.
Which function has the greater rate of change? What is the easiest way to find the rate of change when given a table of values?
Function A has the greater rate of change. Function A has a rate of change of 5, while function B has a rate of change of 3. To find the rate of change when given a table of values, you can either plot the points on a coordinate plane, then count change in y to change in x. Or, you can use the slope formula of
Is it more helpful to see a function represented as a table or equation? Answers may vary. When is it more helpful as a table? A table can be helpful when determining another ordered pair in the function. When is it more helpful as an equation? It is easy to find the slope and y-intercept from an equation.
Graph both the table and equation. Now, is it more helpful to see a function as a table, equation or graph?
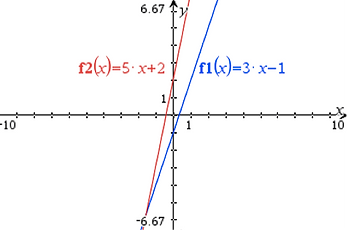
It is easiest to compare functions when they are both graphed.
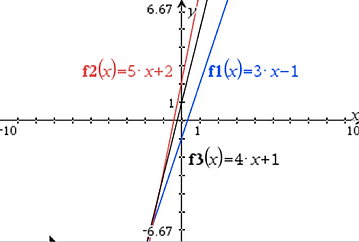
Can you write an equation of a line whose slope is between the slope of Function A and B and whose y-intercept is between the y-intercept of Function A and B?
y = 4x + 1
What would this line look like when graphed with Functions A and B?
When graphed, y = 4x + 1 shows a line that is in between y = 5x + 2 and y = 3x – 1.
Additional Resources
Illustrative Mathematics
http://tasks.illustrativemathematics.org/content-standards/8/F/A/2/tasks/641