
EIGHT GRADE > 8.EE.5 > TEACHER GUIDE
TEACHER GUIDE TO CLARIFICATION

8.EE.5
Understand the connections between proportional relationships, lines and linear equations.
8.EE.5 Graph proportional relationships, interpreting the unit rate as the slope of the graph. Compare two different proportional relationships represented in different ways. For example, compare a distance-time graph to a distance-time equation to determine which of two moving objects has greater speed.
Interpret Unit Rate as the Slope of the Graph
This standard has students comparing two different proportional relationships represented in different ways. For example, the students may compare a graph, table or equation.
Explanations and Examples
8.EE.5 Students build on their work with unit rates from 6th grade and proportional relationships in 7th grade to compare graphs, tables and equations of proportional relationships. Students identify the unit rate (or slope) in graphs, tables and equations to compare two or more proportional relationships.
Using graphs of experiences that are familiar to students increases accessibility and supports understanding and interpretation of proportional relationship. Students are expected to both sketch and interpret graphs.

Comparing:
Graphs
Tables
Equations
Example 1:
* Determine the cost (unit rate) to buy one apple. Which store is more expensive?
Store A:
y = 0.35x
x = # of apples
y = cost of apples
Store B:
Number of apples
Cost
5
8
12
15
$1.50
$2.40
$3.60
$4.50
In example # 1, the unit rate (slope) for Store A is $0.35 per apple. At store b, the unit rate (slope) is $0.30 per apple. So Store A is more expensive.
Example 2:
* Compare the scenarios to determine which represents a greater speed. Include a description of each scenario
including the unit rates in your explanation.
Scenario 1:
Scenario 2:
y = 50x
x is time in hours
y is distance in miles

Interpreting Unit Rate as Slope
Instructional Strategies
This cluster focuses on extending the understanding of ratios and proportions. Unit rates have been explored in Grade 6 as the comparison of two different quantities with the second unit a unit of one, (unit rate). In seventh grade unit rates were expanded to complex fractions and percents through solving multistep problems such as: discounts, interest, taxes, tips, and percent of increase or decrease. Proportional relationships were applied in scale drawings, and students should have developed an informal understanding that the steepness of the graph is the slope or unit rate. Now unit rates are addressed formally in graphical representations, algebraic equations, and geometry through similar triangles.

Emphasize the creation of representative graphs and the meaning of various points.
Distance time problems are notorious in mathematics. In this cluster, they serve the purpose of illustrating how the rates of two objects can be represented, analyzed and described in different ways: graphically and algebraically. Emphasize the creation of representative graphs and the meaning of various points. Then compare the same information when represented in an equation. By using coordinate grids and various sets of three similar triangles, students can prove that the slopes of the corresponding sides are equal, thus making the unit rate of change equal. After proving with multiple sets of triangles, students can be led to generalize the slope to y = mx for a line through the origin and y = mx + b for a line through the vertical axis at b.
Kansas Association of Teachers of Mathematics (KATM) Flipbooks. Questions or to send feedback: melisa@ksu.edu.
Retrieved from Math Flipbooks.

Math Practice 7: Look for and make use of structure
Math practice 7 asks students to look for and make use of structure. In this standard, students are asked to interpret the meaning of slope as a unit rate. They had experience with unit rates in grade 7 as they studied proportional relationships. Now they are connecting that the unit rate is the slope when the information is graphed.
Coherence and Connections: Need to Know
Grade Below
Grade Level
Grade Above
7.RP.2
8.EE.6
8.EE.5
8.F.2
Students build on their knowledge of proportions from sixth and seventh grade. Through 8.EE.5, they begin connecting their knowledge of proportions to slope and unit rate. This in turn will help them when working with functions and equations of a line. As students start to build a unified notion of the concept of function, they are able to compare proportional relationships presented in different ways.
Common Core Standards Writing Team. (2011, April 22).
Progressions for the Common Core State Standards in Mathematics (draft). 6-8, Expressions and Equations.
Tucson, AZ: Institute for Mathematics and Educations, University of Arizona.
Illinois Assessment of Readiness Mathematics Evidence Tables
https://www.isbe.net/Documents/IAR-Grade-8-Math-Evidence-State.pdf
Evidence
Statement Key
Evidence Statement Text
Clarifications
MP
8.EE.5-1
Graph proportional relationships, interpreting the unit rate as the slope of the graph.
i) Tasks may or may not contain context.
1,5
Calculator
Yes
8.EE.5-2
Compare two different proportional relationships represented in different ways. For example, compare a distance-time graph to a distance-time equation to determine which of two moving objects has a greater speed.
i) Tasks may or may not contain context.
Yes
7
Classroom Resources
Teacher Tube lesson on 8.EE.5 This video is helpful for teachers who have never taught comparison of proportional relationships or for teachers who need a refresher course on comparison of proportional relationships. This video is not meant to be shown to students. Teachers should be moving away from direct instruction. Students learn best when they are working in class, not taking notes. Give them plenty of problems and allow them to compare tables, graphs and tables.
http://www.teachertube.com/video/lesson-5-write-equations-for-proportional-relationships-359688
This is a Mars Task on Lines, Slopes and Linear Equations. It is a formative assessment lesson.
http://map.mathshell.org/materials/download.php?fileid=1535
HOT Questions
1. The points in the table lie on a line.
x
y
2
1
4
2
6
3
8
4
Does the table above or the equation y = 0.75x have a greater slope? Explain your reasoning.
Answer:
The slope of the table is 1/2. The slope of the table can be found by either plotting the points or using the slope formula to determine the slope of 1/2. The equation has the greater slope with 0.75 as the slope in the equation is the coefficient of x. Since 0.75 is larger than 1/2, the equation has the greater slope.
2. Draw a graph that has a greater slope than both the table and the equation.
Answer:
Any line that has a slope greater than ¾ will have a slope greater than the table and equation.

3. The graph and table below show information about two landscaping companies.
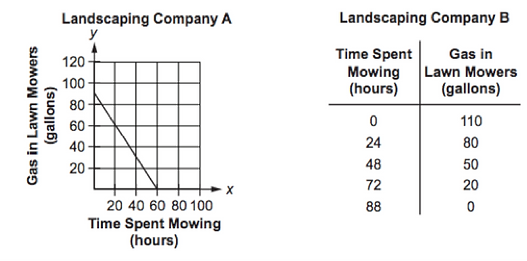
Select all statements that are correct based on the information above.
A. Landscaping company A mows for 28 more hours than landscaping company B.
B. Landscaping company B mows for 28 more hours than landscaping company A.
C. Landscaping company A uses 0.25 of a gallon more gasoline per hour than landscaping company B.
D. Landscaping company B uses 0.25 of a gallon more gasoline per hour than landscaping company A.
Answer:
Both choices B and C are correct.
Landscaping problem adapted from PARCC sample test items.
4. Mati ran in a race that could be modeled by the table:
Time in seconds
Distance in meters
1
3
6
4
2
3
9
12
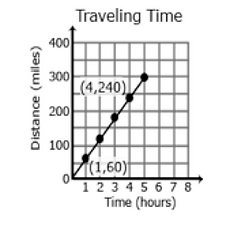
Spencer ran in the same race and his results are graphed below. Who is faster?

Answer:
Spencer is faster. He runs 4 meters per second while Mati runs 3 meters per second.
Austin ran in the same race and his results can be modeled by y = 5x. Is it easier to find the rate of change from a table, graph or equation?
Answer:
Answers may vary. Many students like to compare equations since the rate of change is the coefficient of the x.
5. There are two ramps at the park. Which one is steeper?
6 ft

10 ft
10 ft
15 ft
Answer:
The larger ramp is steeper. It has a rate of change of
The smaller ramp has a rate of change of
Can you draw and label a ramp whose steepness is in between the two ramps above?
Answer:
Answers may vary. Common correct answers may be:
19 ft
30 ft
31 ft
50 ft
Additional Resources
Illustrative Mathematics
http://tasks.illustrativemathematics.org/content-standards/8/EE/B/5/tasks/55
http://tasks.illustrativemathematics.org/content-standards/8/EE/B/5/tasks/57
http://tasks.illustrativemathematics.org/content-standards/8/EE/B/5/tasks/86
http://tasks.illustrativemathematics.org/content-standards/8/EE/B/5/tasks/129
http://tasks.illustrativemathematics.org/content-standards/8/EE/B/5/tasks/184
http://tasks.illustrativemathematics.org/content-standards/8/EE/B/5/tasks/1552
Achieve the Core
https://achievethecore.org/page/620/equations-of-lines
IL Classrooms in Action - Formative Assessment
http://www.mathteachersinaction.org/formative-assessment-tasks.html
Inside Mathematics - Problem of the Month (Level D)
https://www.insidemathematics.org/sites/default/files/materials/movin%20%27n%20groovin_31.pdf
Inside Mathematics - Performance Task
https://www.insidemathematics.org/sites/default/files/materials/squares%20and%20circles_3.pdf
Dan Meyer
Graphing Stories. Students watch a 1 – 2 minute video, then graph the activity.
Teachers can download the graph paper from his website:
http://blog.mrmeyer.com/2007/graphing-stories/
Graphing story on time versus distance:
http://www.mrmeyer.com/graphingstories1/graphingstories10.mov
The Roots of the Equation Blog, Steepest stairs and wacky measurements activity
http://rootsoftheequation.wordpress.com/2012/01/16/steepest-stairs-and-wacky-measurements/
Also check out Student Achievement Partners Coherence Map.