
Coherence and Connections: Need to Know
Grade Below
Grade Level
Grade Above
6.RP.2
6.RP.3
7.RP.1
7.RP.2
7.RP.3
7.EE.4a
7.G.1
8.EE.5
8.EE.6
8.F.1
8.F.2
Examples of Opportunities for Connections among Standards, Clusters or Domain
Plotting rational numbers in the coordinate plane (6.NS.8) is part of analyzing proportional relationships (6.RP.3a, 7.RP.2) and will become important for studying linear equations (8.EE.8) and graphs of functions (8.F).
While not required by the standards, it might be considered valuable to expose students to time series data and to time graphs as an appealing way to work with rational numbers in the coordinate plane (6.NS.8). For example, students could create time graphs of temperature measured each hour over a 24-hour period in a place where, to ensure a strong connection to rational numbers, temperature values might cross from positive to negative during the night and back to positive the next day.
Examples of Key Advances from Grade 6 to Grade 7
In grade 6, students learned about negative numbers and the kinds of quantities they can be used to represent; they also learned about absolute value and ordering of rational numbers, including in real-world contexts. In grade 7, students will add, subtract, multiply, and divide within the system of rational numbers.
Students grow in their ability to analyze proportional relationships. They decide whether two quantities are in a proportional relationship (7.RP.2a); they work with percents, including simple interest, percent increase and decrease, tax, markups and markdowns, gratuities and commission, and percent error (7.RP.3); they analyze proportional relationships and solve problems involving unit rates associated with ratios of fractions (e.g., if a person walks 1/2 mile in each 1/4 hour, the unit rate is the complex fraction ½ / ¼ miles per hour or 2 miles per hour) (7.RP.1); and they analyze proportional relationships in geometric figures (7.G.1).
Examples of Opportunities for In-Depth Focus
7.RP.2 Students in grade 7 grow in their ability to recognize, represent, and analyze proportional relationships in various ways, including by using tables, graphs, and equations.

PARCC is suggesting that this standard is an
Opportunity for In-Depth Focus
discovery learning and ample practice for establishing conceptual understanding is encouraged
PARCC Model Content Frameworks: Mathematics Grades 3-11 (version 5). (2017, November).
Retrieved from https://files.eric.ed.gov/fulltext/ED582070.pdf
Illinois Assessment of Readiness Mathematics Evidence Tables https://www.isbe.net/Documents/IAR-Grade-7-Math-Evidence-State.pdf
Evidence
Statement Key
Evidence Statement Text
Clarifications
MP
7.RP.2a
Recognize and represent proportional relationships between quantities:
a. Decide whether two quantities are in a proportional relationship, e.g., by testing for equivalent ratios in a table or graphing on a coordinate plane and observing whether the graph is a straight line through the origin.
i) Tasks have “thin context” or no context.
ii) Tasks are not limited to ratios of whole numbers.
iii) Tasks use only coordinates in Quadrant 1 and use only a positive constant of proportionality.
2,5
7.RP.2b
Recognize and represent proportional relationships between quantities:
b. Identify the constant of proportionality (unit rate) in tables, graphs, equations, diagrams, and verbal descriptions of proportional relationships.
i) Tasks may or may not have a context.
ii) Tasks sample equally across the listed representations (graphs, equations, diagrams, and verbal descriptions).
iii) Tasks use only coordinates in Quadrant 1 and use only a positive constant of proportionality.
2,5,8
Calculator
yes
no
7.RP.2b
Recognize and represent proportional relationships between quantities:
c. Represent proportional relationships by equations. For example, if total cost t is proportional to the number n of items purchased at a constant price p, the
relationship between the total cost and the number of items can be expressed
as t = pn.
i) Tasks have a context.
ii) Tasks use only coordinates in Quadrant 1 and use only a positive constant of proportionality.
2,8
no
7.C.4
Base explanations/reasoning on a coordinate plane diagram (whether provided in the prompt or constructed by the student in her response).
Content Scope: Knowledge and skills articulated in 7.RP.A
i) Tasks use only coordinates in Quadrant 1 and use only a positive constant of proportionality.
2,3,5,6
yes
7.C.6.1
Construct, autonomously, chains of reasoning that will justify or refute propositions or conjectures.
Content Scope: Knowledge and skills articulated in 7.RP.2
i) Tasks use only coordinates in Quadrant 1 and use only a positive constant of proportionality.
2,3,6
yes
7.RP.2d
Recognize and represent proportional relationships between quantities.
d. Explain what a point (x, y) on the graph of a proportional relationships
means in terms of the situation, with special attention to the points (0, 0) and (1, r) where r is the unit rate.
i) Tasks use only coordinates in Quadrant 1 and use only a positive constant of proportionality.
2,4
no
Also check out Student Achievement Partners Coherence Map.
HOT Questions
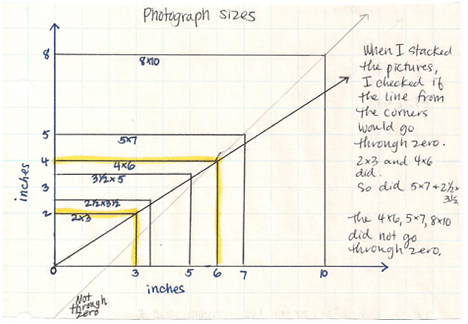
1. Photographs come in several standard print sizes. Some of the most common print sizes are 4x6, 5x7, and 8x10.
(Note: The dimensions are given in inches.) Does a proportional relationship exist between these print sizes?
Justify your answer.
Sample Answer
A proportional relationship does not exist between the sizes of photos. Even though the graph produces a linear function, it does not go through the origin. Since it does not go through the origin the photo sizes cannot be considered
proportional.

Question taken from:
Howard County Wikispace, 2015
2. The table below show how many songs are downloaded for the number of web visits per hour.
12
24
36
60
4
?
12
8
Number of Downloads
Number of Web Visits
a. Is this a directly proportional relationship? Yes
b. What is the constant of proportionality? 1/3 downloads per web visits
c. What is the number of songs downloaded when the number of visits equal 60? 20 songs
3. Mia and Alex make bracelets. Mia can make 13 bracelets in 2 hours. Alex can make 39 bracelets in 5 hours.
a. Do these two friends work at the same rate? No.
b. What is the constant of proportionality (number of bracelets per hour)
Mia 6.5 bracelets per hour. Alex 7.8 bracelets per hour.
4. Create a word problem that describes the number of hours worked at a pizza place and the total amount of money
earned. Then create a graph to show the Constant of Proportionality.
Answers will vary
Additional Resources
Illustrative Mathematics
http://tasks.illustrativemathematics.org/content-standards/7/RP/A/2/tasks/95
http://tasks.illustrativemathematics.org/content-standards/7/RP/A/2/tasks/100
http://tasks.illustrativemathematics.org/content-standards/7/RP/A/2/tasks/101
http://tasks.illustrativemathematics.org/content-standards/7/RP/A/2/tasks/104
http://tasks.illustrativemathematics.org/content-standards/7/RP/A/2/tasks/180
http://tasks.illustrativemathematics.org/content-standards/7/RP/A/2/tasks/181
http://tasks.illustrativemathematics.org/content-standards/7/RP/A/2/tasks/1178
http://tasks.illustrativemathematics.org/content-standards/7/RP/A/2/tasks/1183
http://tasks.illustrativemathematics.org/content-standards/7/RP/A/2/tasks/1186
http://tasks.illustrativemathematics.org/content-standards/7/RP/A/2/tasks/1201
http://tasks.illustrativemathematics.org/content-standards/7/RP/A/2/tasks/1526
http://tasks.illustrativemathematics.org/content-standards/7/RP/A/2/tasks/1527
http://tasks.illustrativemathematics.org/content-standards/7/RP/A/2/tasks/1968
http://tasks.illustrativemathematics.org/content-standards/7/RP/A/2/tasks/1972
http://tasks.illustrativemathematics.org/content-standards/7/RP/A/2/tasks/1983
Achieve the Core
https://achievethecore.org/page/880/art-class-assessment-variation
IL Classrooms in Action - Formative Assessment
http://www.mathteachersinaction.org/formative-assessment-tasks.html
Inside Mathematics - Performance Task
https://www.insidemathematics.org/sites/default/files/materials/cat%20food_2.pdf
https://www.insidemathematics.org/sites/default/files/materials/cereal_4.pdf
https://www.insidemathematics.org/sites/default/files/materials/photographs_2.pdf
https://www.insidemathematics.org/sites/default/files/materials/lawn%20mowing_3.pdf
Inside Mathematics - Problem of the Month
Level D - https://www.insidemathematics.org/sites/default/files/materials/circular%20reasoning_43.pdf
Level B - https://www.insidemathematics.org/sites/default/files/materials/circular%20reasoning_43.pdf
Level D - https://www.insidemathematics.org/sites/default/files/materials/movin%20%27n%20groovin_30.pdf
SEVENTH GRADE > 7.RP.2 > TEACHER GUIDE

TEACHER GUIDE TO CLARIFICATION
7.RP.2
Analyze proportional relationships and use them to solve real-world and mathematical problems.
7.RP.2 Recognize and represent proportional relationships between quantities.
a. Decide whether two quantities are in a proportional relationship, e.g. by testing for equivalent ratios in a table or
graphing on a coordinate plane and observing whether the graph is a straight line through the origin.
b. Identify the constant of proportionality (unit rate) in tables, graphs, equations, diagrams, and verbal descriptions of
proportional relationships.
c. Represent proportional relationships by equations. For example, if total cost t is proportional to the number n of items
purchased as a constant price p, the relationship between the total cost and the number of items can be expressed as
t = pn.
d. Explain what a point (x,y) on the graph of a proportional relationship means in terms of the situation, with special
attention to the points (0,0) and (1,r) where r is the unit rate.
Represent Proportional Relationships Between Quantitates
In this standard students will:
-
test for equivalent ratios through use of a ratio table or by graphing on a coordinate plane
-
Identify unit rate through the use of tables, graphs, equations, diagrams, and verbal descriptions of proportional relationships.
-
Explain what a point (x,y) on the graph of a proportional relationship means in terms of the situation, including describing (0,0) and (1,r) where r is the unit rate.

Students are really incorporating the use of coordinate graphs to explain and reason proportionality. In the past, these two topics of proportions and graphing might not have been so closely related or taught together.
Explanations and Examples:
Students’ understanding of the multiplicative reasoning used with proportions continues from 6th grade. Students determine if two quantities are in a proportional relationship from a table.
For example, the table below gives the price for different number of books.
Do the numbers in the table represent a proportional relationship?
Number of Books
Price in Dollars
1
3
4
7
3
9
12
18
Students can examine the numbers to see that 1 book at 3 dollars is equivalent to 4 books for 12 dollars since both sides of the tables can be multiplied by 4. However, the 7 and 18 are not proportional since 1 book multiplied by 7 and 3 dollars multiplied by 7 will not give 7 books for 18 dollars. Seven books for $18 is not proportional to the other amounts in the table; therefore, there is not a constant of proportionality.
Explanations and Examples:
Students graph relationships to determine if two quantities are in a proportional relationship and interpret the ordered pairs. If the amounts from the table above are graphed (number of books, price), the pairs (1, 3), (3, 9), and (4, 12) will form a straight line through the origin (0 books cost 0 dollars), indicating that these pairs are in a proportional relationship. The ordered pair (4, 12) means that 4 books cost $12. However, the ordered pair (7, 18) would not be on the line, indicating that it is not proportional to the other pairs.
The ordered pair (1, 3) indicates that 1 book is $3, which is the unit rate. The y-coordinate when x = 1 will be the unit rate. The constant of proportionality is the unit rate. Students identify this amount from tables (see example above), graphs, equations and verbal descriptions of proportional relationships.
Take time to allow students to investigate tables and decide if there is a constant of proportionality

Let’s look at a graph example:
The graph below represents the price of the bananas at one store. What is the constant of proportionality? From the graph, it can be determined that 4 pounds of bananas is $1.00; therefore, 1 pound of bananas is $0.25, which is the constant of proportionality for the graph.

Note: Any point on the graph will yield this constant of proportionality.
The cost of bananas at another store can be determined by the equation: P = $0.35n, where P is the price and n is the number of pounds. What is the constant of proportionality (unit rate)?
Students write equations from context and identify the coefficient as the unit rate which is also the constant of proportionality.

Keep in mind this standard focuses on the REPRESENTATIONS OF PROPORTIONS.
Solving Proportions is addressed in 7.RP.3
Examples:
A student is making trail mix. Create a graph to determine if the quantities of nuts and fruit are proportional for each serving size listed in the table. If the quantities are proportional, what is the constant of proportionality or unit rate that defines the relationship? Explain how you determined the constant of proportionality and how it relates to both the table and graph.


The relationship is proportional. For each of the other serving sizes there are 2 cups of fruit for every 1 cup of nuts (2:1). The constant of proportionality is shown in the first column of the table and by the slope of the line on the graph.
The graph below represents the cost of gum packs as a unit rate of $2 dollars for every pack of gum. The unit rate is represented as $2 per pack. Represent the relationship using a table and an equation.
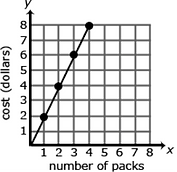
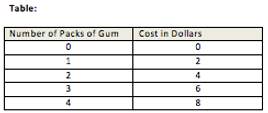
Equation: d = 2g, where d is the cost in dollars and g is the packs of gum.

A common error is to reverse the position of the variables when writing equations

Students may find it useful to use variables specifically related to the quantities rather than using x and y. Constructing verbal models can also be helpful. A student might describe the situation as “the number of packs of gum times the cost for each pack is the total cost in dollars”. They can use this verbal model to construct the equation. Students can check their equation by substituting values and comparing their results to the table.
The checking process helps student revise and recheck their model as necessary. The number of packs of gum times the cost for each pack is the total cost 𝑔×2=𝑑.
Kansas Association of Teachers of Mathematics (KATM) Flipbooks. Questions or to send feedback: melisa@ksu.edu.
Retrieved from Math Flipbooks.
Recognizing proportional relationships Students examine situations carefully, to determine if they describe a proportional relationship. 7.RP.2a For example, if Josh is 10 and Reina is 7, how old will Reina be when Josh is 20?
We cannot solve this problem with the proportion = because it is not the case that for every 10 years that Josh ages, Reina ages 7 years. Instead, when Josh has aged 10 another years, Reina will as well, and so she will be 17 when Josh is 20.

Students will have a tendency to set up a proportion if that is the only tool or strategy they have available. It is up to the educator to allow them to reason through with the use of tables, graphs and verbal descriptions.
For example, if it takes 2 people 5 hours to paint a fence, how long will it take 4 people to paint a fence of the same size (assuming all the people work at the same steady rate)? We cannot solve this problem with the proportion
because it is not the case that for every 2 people, 5 hours of work are needed to paint the fence.
When more people work, it will take fewer hours. With twice as many people working, it will take half as long, so it will take only 2.5 hours for 4 people to paint a fence. Students must understand the structure of the problem, which includes looking for and understand the roles of “for every”, “for each”, and “per”.

This concept of halving the workload is difficult for some students and needs to be explored and reasoned out.
Students recognize that graphs that are not lines through the origin and tables in which there is not a constant ratio in the entries do not represent proportional relationships. For example, consider circular patios that could be made with a range of diameters. For such patios, the area (and therefore the number of pavers it takes to make the patio) is not proportionally related to the diameter, although the circumference (and therefore the length of stone border it takes to encircle the patio) is proportionally related to the diameter. Note that in the case of the circumference, C, of a circle of diameter D, the constant of proportionality in C = π * D is the number π, which is not a rational number.
Equations for proportional relationships As students work with proportional relationships, they write equations of the form y = cx, where c is a constant of proportionality, i.e., a unit rate.7.RP.2c They see this unit rate as the amount of increase in y as x increases by 1 unit in a ratio table and they recognize the unit rate as the vertical increase in a “unit rate triangle” or “slope triangle” with horizontal side of length 1 for a graph of a proportional relationship. 7.RP.2b
Students connect their work with equations to their work with tables and diagrams.
For example, if Seth runs 5 meters every 2 seconds, then how long will it take Seth to run 100 meters at that rate?
The traditional method is to formulate an equation, cross-multiply, and solve the resulting equation to solve the problem. If, are viewed as unit rates obtained from the equivalent ratios 5 : 2 and 100 : T , then they must be equivalent fractions because equivalent ratios have the same unit rate. To see the rationale for cross-multiplying, note that when the fractions are given the common denominator 2 * T , then the numerators become 5 *T and 2 * 100 respectively. Once the denominators are equal, the fractions are equal exactly when their numerators are equal, so 5*T must equal 2 *100 for the unit rates to be equal. This is why we can solve the equation 5 * T = 2 * 100 to find the amount of time it will take for Seth to run 100 meters.

The common error in setting up proportions is placing numbers in incorrect locations. This is especially easy to do when the order in which quantities are stated in the problem is switched within the problem statement.
For example, the second of the following two problem statements is more difficult than the first because of the reversal
“If a factory produces 5 cans of dog food for every 3 cans
of cat food, then when the company produces 600 cans
of dog food, how many cans of cat food will it produce?”
“If a factory produces 5 cans of dog food for every 3
cans of cat food, then how many cans of cat food will
the company produce when it produces 600 cans of dog
food?”
Such problems can be framed in terms of proportional relationships and the constant of proportionality or unit rate, which is obscured by the traditional method of setting up proportions. For example, if Seth runs 5 meters every 2 seconds, he runs at a rate of 2.5 meters per second, so distance d (in meters) and time t (in seconds) are related by d = 2.5t.
If d = 100 then t = = 40 so he takes 40 seconds to run 100 meters.
Common Core Standards Writing Team. (2011, December 26).
Progressions for the Common Core State Standards in Mathematics (draft). 6-7, Ratios and Proportional Relationships. Tucson, AZ: Institute for Mathematics and Educations, University of Arizona.
For additional information go to Achieve the Core.