
TEACHER GUIDE TO CLARIFICATION
Building Ratio Reasoning Conceptually with Multiple Representations
This standard builds the foundation for building conceptual knowledge needed to understand and use ratios. This is not the grade level to lay down standard algorithms or other short cuts. (i.e., magic box or is over of = % over 100) Even in 7th grade these short cuts are not encouraged.

Slow this unit down and really allow students to investigate ratios in terms of composing and decomposing with multiple strategies

In the standard, it specifically lists four strategies students can use to reason and solve rate and ratio problems. These strategies should be modeled and explored by the students so they can determine a method that works best for them. These strategies should be part of a teachers lesson plan, which may require supplementing. In this Teacher Guide, the focus will be on the highlighted strategies
-
tables of equivalent ratios
-
tape diagrams
-
double number line diagrams
-
equations
3b - Solve unit rate problems including those involving unit pricing and constant speed. For example, if it took 7 hours to mow 4 lawns, then at that rate, how many lawns could be mowed in 35 hours? At what rate were lawns being mowed?
Unit Rate – Double Number Line Diagram
For every three hours of babysitting Janette makes $36.00. How much will she make in 7 hours?
Hours 1 2 3 4 5 6 7
Money $36.00
This is what we know so far. Now we need to use this diagram to find the unit rate of how much Janette will make per hour and then use that to find out how much she will make for babysitting for 7 hours.
If Janette makes $36.00 for every 3 hours, I can split 36 up into 3.
So she makes $12.00 an hour.
Hours 1 2 3 4 5 6 7
Money $12.00 $24.00 $36.00 $48.00 $60.00 $72.00 $84.00
Janette will make $84.00 for babysitting 7 hours
Unit Pricing – Tape Diagram
2 liters of Milk costs $3.80
1.5 liters of Milk costs $2.70
Which is the better buy?

A student can think about it in a couple different ways using a Tape Diagram. One way is represented below.
When using a tape diagram students are trying to make or compare similar units. In this case the student will compare ½ liters to ½ liters
2 liters broke down to ½ liters so $3.80 divided by 4 = 0.95 cents
1.5 liters broke down to ½ liters so 2.70 divided by 3 = 0.90 cents
So 1.5 liters is a better buy
Constant Rate of Speed – Ratio Table
A train moving at a constant rate of speed travels 260 miles in 5 hours, at this rate how many miles will the train travel in 9 hours?
Miles
Hours
1
2
3
4
5
6
7
8
9
260
?
Students need to think multiplicatively, if 260 miles is how far they traveled in 5 hours then I need to divide that 260, five times.
The train will travel 52 miles in 1 hour. Now I can multiply $52 x 9 = 468 miles in 9 hours
Miles
Hours
1
2
3
4
5
6
7
8
9
260
468
52
104
156
208
312
364
416
This ratio table could also “look” like a double number line diagram.

Tape Diagrams are used as a way to organize data. Once students have this strategy as a tool, the way in which they use it is remarkable.
Truly a gem of a visual tool to use
Here is an example of a higher level question given a certain rate, using a Tape Diagram.
“A car sales person earns $800.00 for every car sold. An additional $2,500 for every 10 cars sold in one month. How many cars need to be sold in order to earn $23,400 in one month?”
Interesting to see how students would try to solve this one?!?!?!
800
800
800
800
800
800
800
800
800
800
2500
I know that I will make $10,500 in one month if I sell 10 cars. So I will need to sell at least double that plus some more
23,400 – 21,000 = 2,400
I know I can sell three more cars for $2,400. My total cars sold would need to equal 23.”
Adapted from 70 Must Know Word Problems Level 5 pg. 92
3c - Find a percent of a quantity as a rate per 100 (e.g., 30% of a quantity means 30/100 times the quantity); solve problems involving finding the whole, given a part and the percent.

Allow students to really reason these percent problems out. This is not the time to pull out the Percent of a Number Unit.
Let students reason and understand by composing and decomposing percent. Do not lay down any short cuts or standard algorithms at first. Some students don’t understand why these percent proportions work. Often students put the wrong numbers in the wrong places.

Standard 3c wants students to find a percent of a quantity involving finding the whole, given a part and the percent, by using Tape Diagrams, Double Number Line Diagrams and other visual models or representations in order to build conceptual understanding.

This Example from the Progression Document gives a variety of ways to solve

Let’s solve some Percent Problems
What is 60% of 340?
I know that each section is 10% so If I split up 340 into 10 that would be 34 in each section.
So 6 x 34 = 204
What is 6% of 250?
Teacher asks: Will it be a whole number? What is a guess that is too high? What is a guess that is too low?
I know 6% of 100 is 6. So 6% of 200 is 12 plus another half of 6 (for the 50) which is 3.
12 + 3 = 15
If 6 is 30% of a value, what is the value?
This represents 6 and 30% plus another 6 plus another 6
How do I know what one unit represents? If three equals 6 then one must equal 2.
6 + 6 + 6 + 2 = 20
8 is what percent of 20?
The whole tape diagram represents 20 at 100%.
20 is split into 10. So that means each unit is worth 2. And each unit is worth 10 percent
So we can shade in 4 unit which equals 8 and 40%
8 is 40% of 20
HOT Question:
Jackie bought a pair of gym shoes for $54.00. She saved 40%. How much did she save?

There are many ways to think of this one…
So now I have to figure out how much she saved or if $54.00 is 60% then what will 40% equal.
I can split the 54 up into 6 groups of 9. This will give me how much 10% equals, which is 9.
So 9 times 4 = 36 Jackie saved $36.00
What else can we ask about this problem?
Ex. What was the original price?

Notice no percent proportions were used to solve these problems. We want students to have multiple tools to solve the problems. Students need to be able to make sense of the problems (MP.1) and reason through them.
Examples of Opportunities for Connections among Standards, Clusters or Domains
-
Plotting rational numbers in the coordinate plane (6.NS.8) is part of analyzing proportional relationships (6.RP.3a, 7.RP.2) and will become important for studying linear equations (8.EE.8) and graphs of functions (8.F).15
15 While not required by the standards, it might be considered valuable to expose students to time series data and to time graphs as an appealing way to work with rational numbers in the coordinate plane (6.NS.8). For example, students could create time graphs of temperature measured each hour over a 24-hour period in a place where, to ensure a strong connection to rational numbers, temperature values might cross from positive to negative during the night and back to positive the next day.
Examples of Opportunities for In-Depth Focus
-
6.RP.3 When students work toward meeting this standard, they use a range of reasoning and representations to analyze proportional relationships.
Other lasting achievements from K-8 would include working with proportional relationships and unit rates (6.RP.3; 7.RP.1, 2); working with percentages (6.RP.3e; 7.RP.3); and working with area, surface area, and volume (7.G.4, 6).
PARCC Model Content Frameworks: Mathematics Grades 3-11 (version 5). (2017, November).
Retrieved from https://files.eric.ed.gov/fulltext/ED582070.pdf
“Representing and reasoning about ratios and collections of equivalent Ratios
Because the multiplication table is familiar to sixth graders, situations that give rise to columns or rows of a multiplication table can provide good initial contexts when ratios and proportional relationships are introduced. Pairs of quantities in equivalent ratios arising from whole number measurements such as “3 lemons for every $1” or “for every 5 cups grape juice, mix in 2 cups peach juice” lend themselves to being recorded in a table.6.RP.3a Initially, when students make tables of quantities in equivalent ratios, they may focus only on iterating the related quantities by repeated addition to generate equivalent ratios.”

Common Core Standards Writing Team. (2011, December 26).
Progressions for the Common Core State Standards in Mathematics(draft). 6-7, Ratios and Proportional Relationships. Tucson, AZ: Institute for Mathematics and Educations, University of Arizona.
For additional information go to Achieve the Core.

6.RP.3 a,b,c,d
Understand ratio concepts and use ratio reasoning to solve problems.
6.RP.3 Understand ratio and rate reasoning to solve real-world and mathematical problems, e.g., by reasoning about tables of equivalent ratios, tape diagrams, double number line diagrams, or equations.
3a - Make tables of equivalent ratios relating quantities with whole-number measurements, find missing values in the tables, and plot the pairs of values on the coordinate plane. Use tables to compare ratios.
3b - Solve unit rate problems including those involving unit pricing and constant speed. For example, if it took 7 hours to mow 4 lawns, then at that rate, how many lawns could be mowed in 35 hours? At what rate were lawns being mowed?
3c - Find a percent of a quantity as a rate per 100 (e.g., 30% of a quantity means 30/100 times the quantity); solve problems involving finding the whole, given a part and the percent.
3d - Use ratio reasoning to convert measurement units; manipulate and transform units appropriately when multiplying or dividing quantities.
Coherence and Connections: Need to Know
Grade Below
Grade Level
Grade Above
5.G.2
6.RP.1
6.RP.2
6.RP.3
6.EE.7
6.EE.9
7.RP.2
7.RP.3
Illinois Assessment for Readiness Mathematics Evidence Tables https://www.isbe.net/Documents/IAR-Grade-6-Math-Evidence-State.pdf
Evidence
Statement Key
Evidence Statement Text
Clarifications
MP
6.RP.3a
Use ratio and rate reasoning to solve real-world and mathematical problems, e.g., by reasoning about tables of equivalent ratios, tape diagrams, double number line diagrams, or equations. a. Make tables of equivalent ratios relating quantities with whole-number measurements, find missing values in the tables, and plot the pairs of values on the coordinate plane. Use tables to compare ratios.
i) Expectations for ratios in this grade are limited to ratios of noncomplex fractions. The initial numerator and denominator should be whole numbers.
2,4,5,7,8
6.C.8.1
Present solutions to multi-step problems in the form of valid chains of reasoning, using symbols such as equals signs appropriately (for example, rubrics award less than full credit for the presence of nonsense statements such as 1 + 4 = 5 + 7 = 12, even if the final answer is correct), or identify or describe errors in solutions to multi-step problems and present corrected solutions. Content Scope: Knowledge and skills articulated in 6.RP.A
i) Expectations for ratios in this grade are limited to ratios of noncomplex fractions. The initial numerator and denominator should be whole numbers.
2,3,6
yes
Calculator
yes
6.RP.3c-1
Use ratio and rate reasoning to solve real-world and mathematical problems, e.g., by reasoning about tables of equivalent ratios, tape diagrams, double number line diagrams, or equations. c. Find a percent of a quantity as a rate per 100 (e.g., 30% of a quantity means 30/100 times the quantity);
i) Tasks may or may not contain context.
ii) Expectations for ratios in this grade are limited to ratios of noncomplex fractions. The initial numerator and denominator should be whole numbers.
2,5,7,8
yes
6.RP.3c-2
Use ratio and rate reasoning to solve real-world and mathematical problems, e.g., by reasoning about tables of equivalent ratios, tape diagrams, double number line diagrams, or equations. c. Solve problems involving finding the whole, given a part and the percent.
i) Expectations for ratios in this grade are limited to ratios of non-complex fractions. The initial numerator and denominator should be whole numbers.
2,5,7,8
yes
6.RP.3d
Use ratio and rate reasoning to solve real-world and mathematical problems, e.g., by reasoning about tables of equivalent ratios, tape diagrams, double number line diagrams, or equations. d. Use ratio reasoning to convert measurement units; manipulate and transform units appropriately when multiplying or dividing quantities.
I) Tasks may or may not contain context.
ii) Tasks require students to multiply and/or divide dimensioned quantities.
iii) Half of the tasks require students to correctly express the units of the result.
iv) Expectations for ratios in this grade are limited to ratios of noncomplex fractions. (See footnote, CCSS p 42.) The initial numerator and denominator should be whole numbers.
2,5,6,
7,8
yes
HOT Questions
1. 2 pencils and 3 pens cost $18.80. 6 pencils and 6 pens cost $45.
a. How much does a pen cost? $3.70
b. How much more does a pen cost than a pencil? $.90
2. A runner ran 20 miles in 150 minutes. How long will it take her to run 6 miles?
45 minutes
3. 18 is 30% of what number? 60
18 is equal to 30%
So to figure out the number or 100% I will find how much is in 10%.
18 ÷ 3 = 6 6 x 10 = 60
4. If Kroger is selling 8 yogurts for $10; how much yogurt can be bought with $35? Show at least two different ways to
get this answer.

I was adding 8 so I decided to add half of 8; but if I add half of 8, I also need to add half of 10. In second chart are my answers.
+8
Yogurt
Money
8
10
16
20
24
30
32
40
+10
+4
+4
+4
Yogurt
Money
8
10
12
15
16
20
20
25
30
24
28
35
+5
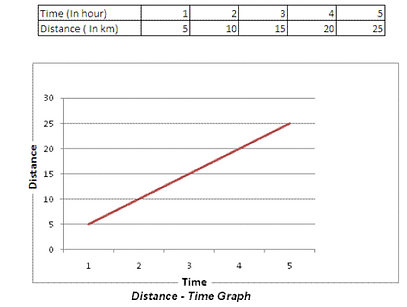
Using the graph below determine how far they will have travel in 12 hours.
Since they are travelling 5 KM per hour after 12 hours they would have travelled 60 km.
Yogurt 8 16 24 28 32
Money 10 20 30 35 40
Half way between 24 and 32 yogurts because half way between 30 and 40 dollars
Additional Resources
Illustrative Mathematics
http://tasks.illustrativemathematics.org/content-standards/6/RP/A/3/tasks/53
http://tasks.illustrativemathematics.org/content-standards/6/RP/A/3/tasks/54
http://tasks.illustrativemathematics.org/content-standards/6/RP/A/3/tasks/66
http://tasks.illustrativemathematics.org/content-standards/6/RP/A/3/tasks/67
http://tasks.illustrativemathematics.org/content-standards/6/RP/A/3/tasks/68
http://tasks.illustrativemathematics.org/content-standards/6/RP/A/3/tasks/79
http://tasks.illustrativemathematics.org/content-standards/6/RP/A/3/tasks/115
http://tasks.illustrativemathematics.org/content-standards/6/RP/A/3/tasks/118
http://tasks.illustrativemathematics.org/content-standards/6/RP/A/3/tasks/131
http://tasks.illustrativemathematics.org/content-standards/6/RP/A/3/tasks/134
http://tasks.illustrativemathematics.org/content-standards/6/RP/A/3/tasks/135
http://tasks.illustrativemathematics.org/content-standards/6/RP/A/3/tasks/137
http://tasks.illustrativemathematics.org/content-standards/6/RP/A/3/tasks/193
http://tasks.illustrativemathematics.org/content-standards/6/RP/A/3/tasks/498
http://tasks.illustrativemathematics.org/content-standards/6/RP/A/3/tasks/711
http://tasks.illustrativemathematics.org/content-standards/6/RP/A/3/tasks/815
http://tasks.illustrativemathematics.org/content-standards/6/RP/A/3/tasks/899
http://tasks.illustrativemathematics.org/content-standards/6/RP/A/3/tasks/912
http://tasks.illustrativemathematics.org/content-standards/6/RP/A/3/tasks/997
http://tasks.illustrativemathematics.org/content-standards/6/RP/A/3/tasks/1032
http://tasks.illustrativemathematics.org/content-standards/6/RP/A/3/tasks/1175
http://tasks.illustrativemathematics.org/content-standards/6/RP/A/3/tasks/1291
http://tasks.illustrativemathematics.org/content-standards/6/RP/A/3/tasks/1636
http://tasks.illustrativemathematics.org/content-standards/6/RP/A/3/tasks/1641
http://tasks.illustrativemathematics.org/content-standards/6/RP/A/3/tasks/1969
http://tasks.illustrativemathematics.org/content-standards/6/RP/A/3/tasks/1975
http://tasks.illustrativemathematics.org/content-standards/6/RP/A/3/tasks/1982
http://tasks.illustrativemathematics.org/content-standards/6/RP/A/3/tasks/1996
http://tasks.illustrativemathematics.org/content-standards/6/RP/A/3/tasks/2049
http://tasks.illustrativemathematics.org/content-standards/6/RP/A/3/tasks/2051
http://tasks.illustrativemathematics.org/content-standards/6/RP/A/3/tasks/2052
http://tasks.illustrativemathematics.org/content-standards/6/RP/A/3/tasks/2094
http://tasks.illustrativemathematics.org/content-standards/6/RP/A/3/tasks/2149
http://tasks.illustrativemathematics.org/content-standards/6/RP/A/3/tasks/2153
http://tasks.illustrativemathematics.org/content-standards/6/RP/A/3/tasks/2154
http://tasks.illustrativemathematics.org/content-standards/6/RP/A/3/tasks/2174
Achieve the Core
https://achievethecore.org/page/878/riding-at-a-constant-speed-assessment-variation
Also check out Student Achievement Partners Coherence Map.