
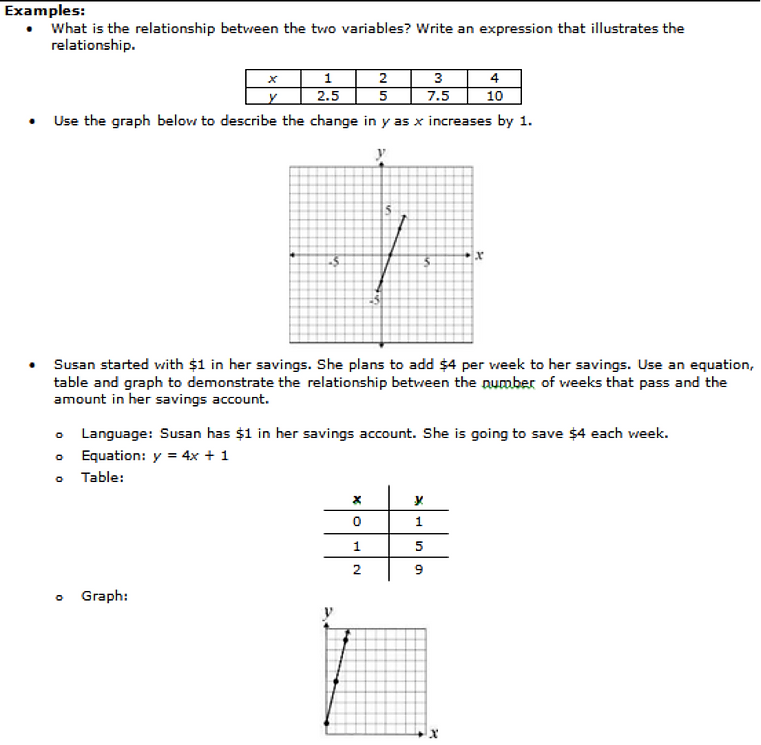
TEACHER GUIDE TO CLARIFICATION
Relationship between Dependent and Independent Variable
At this grade level, students are building a foundation for understanding at a conceptual level regarding the relationship of two variables; in addition to applying their knowledge of dependent and independent variables to solve real-world problems.
The purpose of this standard is for students to understand the relationship between two variables, which begins with the distinction between dependent and independent variables. The independent variable is the variable that can be changed; the dependent variable is the variable that is affected by the change in the independent variable. Students recognize that the independent variable is graphed on the x-axis; the dependent variable is graphed on the y-axis. Students recognize that not all data should be graphed with a line. Data that is discrete would be graphed with coordinates only. Discrete data is data that would not be represented with fractional parts such as people, tents, records, etc. For example, a graph illustrating the cost per person would be graphed with points since part of a person would not be considered. A line is drawn when both variables could be represented with fractional parts.

Because the standard calls for students to represent two-quantities in real-world situations, it is important to discuss discrete data and how that affects plotting points and/or drawing a line on a graph.
Taking the standard deeper to a level of understanding
-
Students are expected to recognize and explain the impact on the dependent variable when the independent variable changes (As the x variable increases, how does the y variable change?) Relationships should be proportional with the line passing through the origin. (highlight these proportional relationships on a graph and show the connection) Additionally, students should be able to write an equation from a word problem and understand how the coefficient of the dependent variable is related to the graph and /or a table of values
-
Students can use many forms to represent relationships between quantities. Multiple representations include describing the relationship using language, a table, an equation, graph or a double number line. Translating between multiple representations helps students understand that each form represents the same relationship and provides a different perspective on the function.
Students can see an expression many different ways, allow them to explore and share why they are equivalent when representing different expressions

The focus is for students to be comfortable with matching or creating the equation to a graph, table or written description that show the same relationship. After, students explore these relationships with the equation and graph, in grade 7 they move to more of the abstract concept, y = mx and the proportional relationship on a graph, and then in 8th grade they create
y = mx + b.
Instructional Strategies:
-
The goal is to help students connect the pieces together. This can be done by having students use multiple representations for the mathematical relationship. Students need to be able to translate freely among the story, words (mathematical phrases), models, tables, graphs and equations. They also need to be able to start with any of the representations and understand or explain the relationship to others.
-
Provide multiple situations for the student to analyze and determine what unknown is dependent on the other components. For example, how much money I make is dependent on my hourly wage.
-
Throughout the expressions and equations domain in Grade 6, students need to have an understanding of how the expressions or equations relate to situations presented, as well as the process of solving them.
-
The use of technology, including computer apps and other hand-held technology allows the collection of real-time data or the use of actual data to create tables and charts. It is valuable for students to realize that although real-world data often is not linear, a line sometimes can model the data. It is important for students to develop this conceptual understanding as students will work more intensively at the high school level with micro-modeling. For example, I can buy six cans of pop for $2.00, a line would not represent this relationship as you cannot have a partial can of pop.
Common Misconceptions:
Students may misunderstand what the graph represents in context. For example, that moving up or down on a graph does not necessarily mean that a person is moving up or down.
Kansas Association of Teachers of Mathematics (KATM) Flipbooks. Questions or to send feedback: melisa@ksu.edu.
Retrieved from Math Flipbooks.
Represent and analyze quantitative relationships between dependent and independent variables. In addition to constructing and solving equations in one variable, students use equations in two variables to express relationships between two quantities that vary together. When they construct an expression like 10 – p to represent a quantity from this table:

Students can choose a variable such as C to represent the calculated quantity and write C = 10 – p to represent the relationship. This prepares students for work with functions in later grades. 6.EE.9 The variable p is the natural choice for the independent variable in this situation, with C the dependent variable. In a situation where the price, p, is to be calculated from the change, C, it might be the other way around.
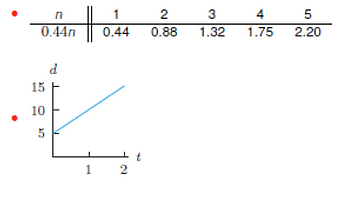
As they work with such equations students begin to develop a dynamic understanding of variables, an appreciation that they can stand for any number from some domain. This use of variables arises when students study expressions such as 0.44n, discussed earlier in the progression document, or equations in two variables such as
d = 5 + 5t describing relationship between distance in miles, d, and time in hours, t, for a person starting 5 miles from home and walking away at 5 miles per hour. Students can use tabular and graphical (see below) representations to develop an appreciation of varying quantities.
Common Core Standards Writing Team. (2011, April 22).
Progressions for the Common Core State Standards in Mathematics (draft). 6-8, Expressions and Equations. Tucson, AZ: Institute for Mathematics and Educations, University of Arizona

6.EE.9
Represent and analyze quantitative relationships between dependent and independent variable.
6.EE.9 Use variables to represent two quantities in a real-world problem that change in relationship to one another; write an equation to express one quantity, thought of as the dependent variable, in terms of the other quantity, thought of as the independent variable. Analyze the relationship between the dependent and independent variables using graphs and tables, and relate these to the equation. For example, in a problem involving motion at constant speed, list and graph ordered pairs of distances and times, and write the equation d=65t to represent the relationship between distance and time.
Coherence and Connections: Need to Know
Grade Below
Grade Level
Grade Above
5.OA.3
6.RP.3a
6.RP.3b
6.EE.7
6.EE.9
Connections:
This cluster is connected to the Grade 6 Critical Area of Focus #3, Writing, interpreting and using expressions, and equations. This cluster, Expressions and Equations, is closely tied to Ratios and Proportional Relationships, allowing the ideas in each to be connected and taught together.
Kansas Association of Teachers of Mathematics (KATM) Flipbooks. Questions or to send feedback: melisa@ksu.edu.
Retrieved from Math Flipbooks.
PARCC Model Content Framework:
Examples for Opportunities for Connections between Standards, Clusters, or Domains
Students’ work with ratios and proportional relationships (6.RP) can be combined with their work in representing quantitative relationships between dependent and independent variables (6.EE.9).
PARCC Model Content Frameworks: Mathematics Grades 3-11 (version 5). (2017, November).
Retrieved from https://files.eric.ed.gov/fulltext/ED582070.pdf
Illinois Assessment of Readiness Mathematics Evidence Tables https://www.isbe.net/Documents/IAR-Grade-6-Math-Evidence-State.pdf
Evidence
Statement Key
Evidence Statement Text
Clarifications
MP
6.EE.9
Use variables to represent two quantities in a real-world problem that change in relationship to one another; write an equation to express one quantity, thought of as the dependent variable, in terms of the other quantity, thought of as the independent variable. Analyze the relationship between the dependent and independent variables using graphs and tables, and relate these to the equation. For example, in a problem involving motion at constant speed, list and graph ordered pairs of distances and times, and write the equation d =65t to represent the relationship between distance and time.
i) Tasks that involve writing an equation should not go beyond the equation types described in 6.EE.7 (x+p =q and px = q where p, q, and x are all nonnegative rational numbers).
2,4,6,8
yes
Calculator
6.C.8.2
Present solutions to multi-step problems in the form of valid chains of reasoning, using symbols such as equals signs appropriately (for example,
rubrics award less than full credit for the presence of nonsense statements such as 1 + 4 = 5 + 7 = 12, even if the final answer is correct), or identify or describe errors in solutions to multi-step problems and present corrected solutions.
Content Scope: Knowledge and skills articulated in 6.EE.9
i) Tasks that involve writing an equation should not go beyond the equation types described in 6.EE.7 (x+p =q and px = q where p, q, and x are all nonnegative rational numbers).
yes
2,3,6
Also check out Student Achievement Partners Coherence Map.
HOT Questions
1. I am graphing my height and age, which variable is the dependent and which variable independent?
Height is dependent upon age. So, height is the dependent variable and age is the independent variable
2a. Megan babysits for $5.50 per hour. Set up an equation to relate the number of hours Megan babysits, h, to the total
amount of money she earns, m.
m = 5h
2b. How much money did she make in 7 ½ hours?
Allow students to solve using multiplicative thinking or with a table, double number diagram, tape diagram.
Example Answer
First I figured out $5.50 7 times which equals $38.50.
Now I need to split 5.50 into 2 groups, to figure out half of an hour. Which would be 2.75.
1 + 1
.50
.25
1 + 1
.50
.25
So 38.50 plus 2.75 = $41.25
2c. If Megan made $35.75 how many hours did she work?
She worked 6 ½ hours
Hours
Total money earned
1
2
3
4
5
6
7
5.50
11
16.5
22
27.5
33
38.5
I know she worked more than 6 hours but less than 7, so I have to figure out 33 +? = 35.75
Which is 2.75. 2.75 is half of $5.50 so Megan worked 6 ½ hours
3. Given the equation y = 5 + x, create a table.
X
Y
X
Y
1
6
2
7
3
8
4
9
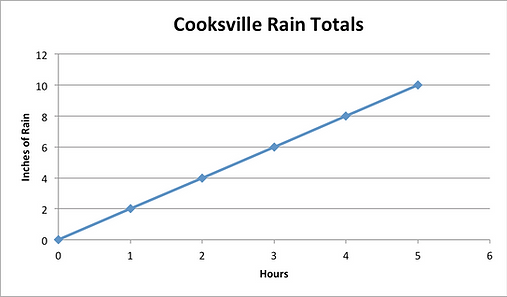
4. Create a graph and an equation to answer the question below. In the spring, rain fell at a rate of 2-inches per hour. In the town of Cooksville it rained for 4 ½ hours. How much rain did they get?
Equation: 4 ½ x 2 = amount of rain in inches
Graph Answer
5. There are 24 students in a classroom and 6 large round tables. Write a question that the double number line would represent.
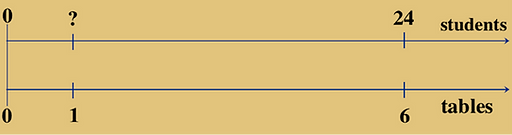
Example response - How many children should be seated at each table if there must be the same number of children
at each table?
If we have six tables, how many students would be at each table if we all want the same amount.
6. Given the tables below create an equation
x
p
2
4
3
5
4
6
5
7
6
?
x + 2 = p
y
z
2
4
3
6
4
8
5
10
6
?
y x 2 = z
Additional Resources
Illustrative Mathematics
http://tasks.illustrativemathematics.org/content-standards/6/EE/C/9/tasks/806
http://tasks.illustrativemathematics.org/content-standards/6/EE/C/9/tasks/2206
Inside Mathematics - Problem of the Month
Level C and D https://www.insidemathematics.org/sites/default/files/materials/measuring%20mammals_35.pdf
Level D and E https://www.insidemathematics.org/sites/default/files/materials/measuring%20up_36.pdf
Level D https://www.insidemathematics.org/sites/default/files/materials/perfect%20pair_40.pdf
Inside Mathematics - Performance Assessment Task
Video of Lesson - https://www.insidemathematics.org/classroom-videos/public-lessons/7th-8th-grade-math-comparing-linear-functions/planning-part-a
Task - https://www.insidemathematics.org/sites/default/files/materials/gym_4.pdf
Howard County
EngageNY
https://www.engageny.org/ccls-math/6ee9